The Euro-Crisis: North, South – and the East?
Alan Greenspan is not the only one to believe that “Europe’s crisis is all about the north-south split” (Financial Times[1], Oct. 9, 2011) This idea has become particularly influential through widespread claims that the way to overcome the Euro-crisis is for Greece and other Mediterranean countries to follow the shining example of Latvia and the other Baltic countries. Such claims have been endorsed by highly influential figures like Christine Lagarde, the IMF head[2] and Jörg Asmussen, Germany’s representative on the Executive Board of the European Central Bank[3].
With regard to the financial crisis, the number one success story among European countries is not Latvia, but Poland (Figure 1). In fact, the people of Latvia – especially those of Russian origin – have experienced some of the hardest pain seen across all over Europe, with little reward except for the praise they sometimes get for achieving outcomes vastly outperformed by Poland. Against that background, it is useful to look more closely in the experience of Eastern European countries. Perhaps there is something to be learned here.

Figure 1, Changes – Governmental purchases vs. real GDP
Source; http://krugman.blogs.nytimes.com/2012/02/18/austerity-and-growth
At least three features of the Polish experience deserve particular attention:
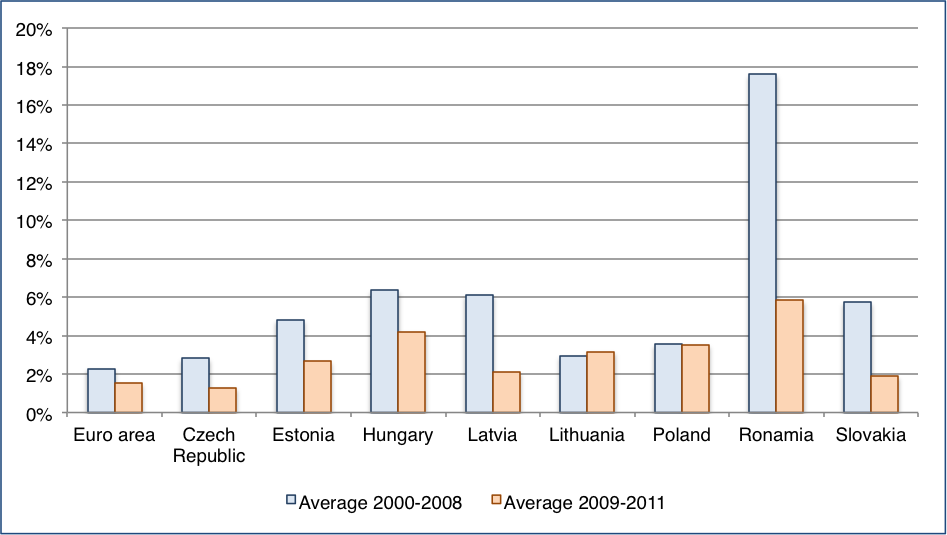
First: While the European Central Bank sticks to its pre-crisis definition of price stability as somewhat less than 2% of inflation (a perfectly arbitrary threshold), Polish inflation was about 50% higher, i.e. around 3%. Figure 2 depicts this fact: while most countries – as well the whole Eurozone – had a significant reduction of inflation since the crisis, Poland stayed at a moderate level of 3-4% over the last decade.

Figure 2, Average inflation in Euro area and NMS states 2000-2011, Source Eurostat
At the same time, while the Eurozone had a decrease of money supply by 3% in 2009, Poland expanded the Zloty supply by 10% and followed an expansive money policy also in 2010. Latvia, Lithuania and at some extent also Bulgaria, Estonia and Romania decreased their money supply when the crisis started (Figure 3).
, 2005-2011")
Figure 3, Percentage change in money aggregates (M1, M2, M3), 2005-2011, Source, Eurostat
Second: While those Eurozone countries where the financial crisis led to a sudden stop of capital inflows had no national currency to devaluate, Poland absorbed part of the financial shock by a temporary devaluation of the Zloty (-30% from October 2008 to March 2009 in relation to the Euro) which decreased labor costs and enhanced the internal and external competitive position of the Polish economy. This was enabled by the Polish floating exchange rate. In comparison, Latvia, Lithuania and Estonia have euro peg currencies.
Third: While Eurozone countries in distress were put under massive pressure to reduce their government’s expenditures, Poland did in fact increase government expenditure in 2009 and 2010 (see Figure 4 and Figure 5).

Figure 4, Percentage changes in governmental expenditures, 2008-2011, Source, Eurostat

Figure 5, Percentage changes in governmental consumption, 2008-2010, Source, Eurostat
Since 2005, Poland kept increasing gross investment while Latvia kept decreasing it after the crisis (Figure 6).

Figure 6, Governmental expenditures for Gross Investments in % of GDP, Source, Eurostat

Figure 7, New governmental indebtedness in % of GDP, Source, Eurostat
While the EU27 and the Eurozone have a deficit of more than 80% of annual GDP, the deficit of the New Member States (except Hungary) is significant less (Figure 8).
Between 2000 and 2007 all EU27 countries (with the exception of Hungary and Poland) reduced their deficit between 1.4% (Estonia) and 55% (Bulgaria). Over the same period, Hungary increased its deficit starting by 11% from a relatively high level in 2000 and Poland by 8.2%.
As a result of the crisis, the growth of deficits between 2008 and 2011 was significant for Latvia (+115%), Lithuania (+148%), Romania (+149%) and Slovenia (+117%).
Comparatively, the Polish situation was less dramatic: the increase of the deficit between 2000 and 2007 was of 8.2% and since 2008 of 20%.

Figure 8, Governmental deficit, % of GDP (bar) and changes 2008-2011 (dot) in %, Source, Eurostat
Poland and Czech Republic were the only two countries, which increased their GDP in 2008. Comparatively, the Baltic countries had a significant reduction in their growth rates: Estonia from 20% to 1%, Latvia from 32% to 9% and Lithuania from 19% to 13% (Figure 9). After a decline in 2009 of 14% Poland was the only country, which recover in 2010 completely, being back to a pre-crisis level.

Figure 9, Average annual GDP growth, 2000-2008 and 2008-2011, Source, Eurostat
While this post attempts to bring into light some of the facts characterizing the economic situation of Poland and of the Baltic countries, we are obviously aware that all of the above constitutes only part of the story. Indeed, further socio-economic circumstances, institutional structures and cultural determinants have their influence on the development of the East Europe and it is not obvious that one or the other political decision brought success in Poland. However, it is important not to overlook Poland when looking for shiny examples of how countries handled and still handle the crisis.